How to track Detectron2 experiments in MLflow
In this blog post, I’ll show you how to integrate MLflow into your ML lifecycle so that you can log artifacts, metrics, and parameters of your model trainings/experiments with Detectron2. As a result, you’ll be able to log training parameters (MODEL.WEIGHTS, OUTPUT_DIR, SOLVER.MAX_ITER, etc), training metrics (AP, duration, loss, etc.), and training artifacts (such as the model itself, training log file, sample images with inference, evaluation results, etc.) to MLflow.
From my understanding, there are two different ways how you could integrate MLflow into Detectron2:
-
Write a custom training loop by creating a subclass of
detectron2.engine.defaults.DefaultTrainer. In this subclass, you could overwriteDefaultTrainer’s methods to log artifacts, metrics, parameters, etc. to MLflow. Example:from detectron2.engine import DefaultTrainer import mlflow class CustomTrainerWithMLflow(DefaultTrainer): @staticmethod def run_step(self): super().run_step() mlflow.log_metric("key", "value") -
My preferred solution: leverage Detectron2’s hook system and implement a custom hook that takes over the recording to MLflow throughout the model training. A custom hook has the advantage over a custom trainer that it can be reused for future model trainings. You can easily hook it into any trainer class even, if you were to switch from object detection to segmentation.
Short intro to experiment tracking with MLflow
To line out the the next steps of this blog post, let’s start with a blazing fast intro to experiment tracking with MLflow and the concepts of MLflow Tracking:
-
Install MLflow from PyPI via
pip install mlflow. -
Start an MLflow tracking server via
mlflow uiand open http://localhost:5000 in your browser to see the MLflow UI. -
Import MLflow in Python via
import mlflow. - Set the tracking server URI:
mlflow.set_tracking_uri("http://localhost:5000") - Experiment: MLflow allows you to group runs under experiments, which can be useful for comparing runs intended to tackle a particular task. This is how the experiment name is set:
mlflow.set_experiment("Balloon Object Detection")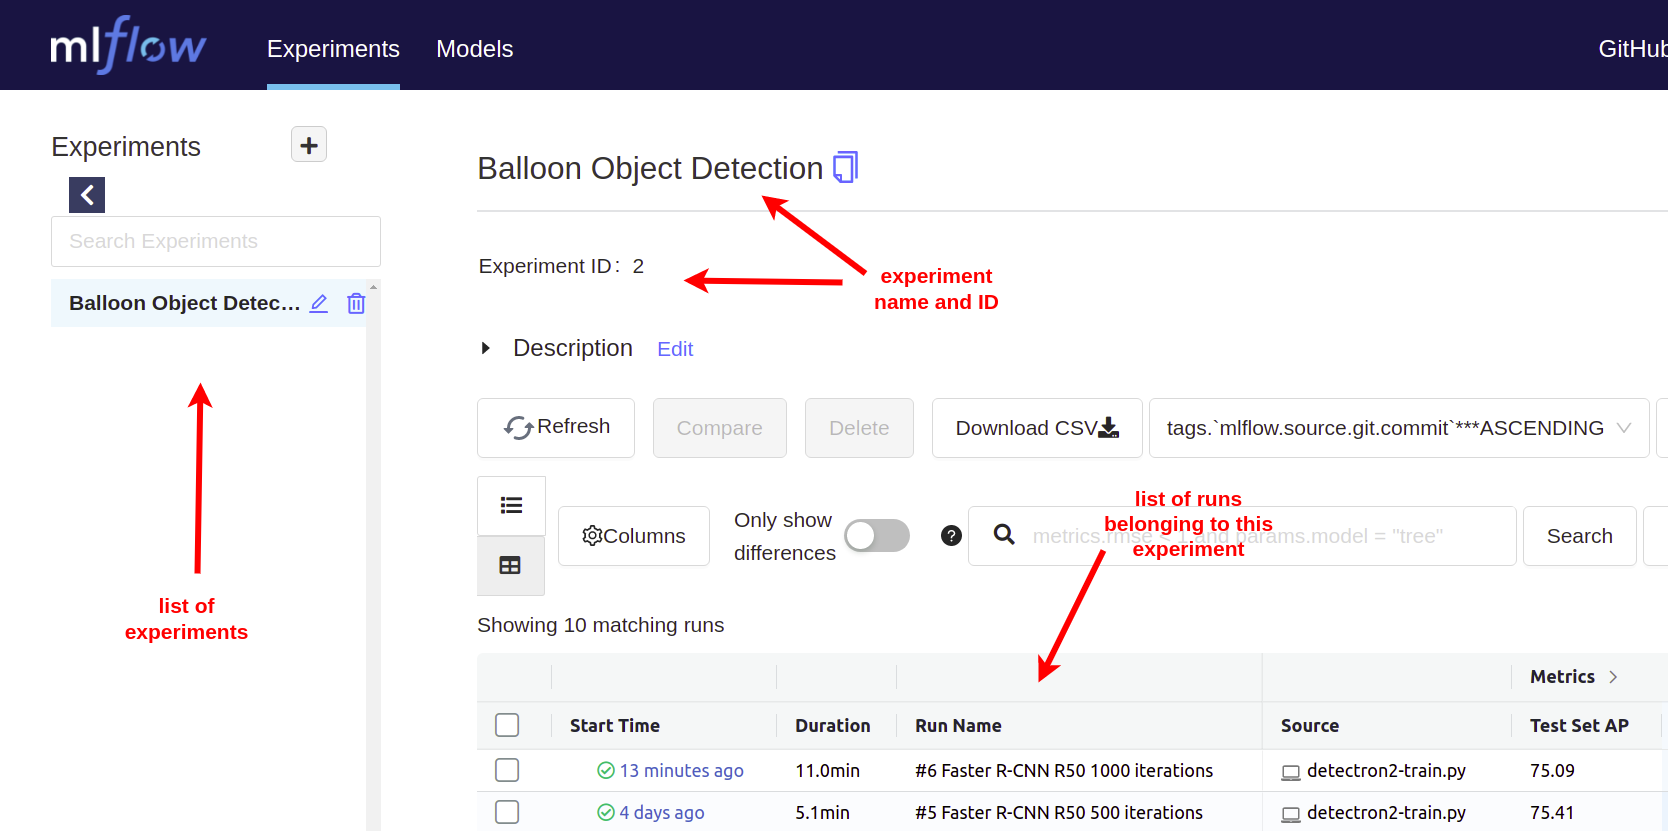
- Run: Each model training should be recorded as a separate run. Runs have a name, description, duration, status, and so on. This is how to start a run:
mlflow.start_run(run_name="#0 first training")
- Parameters: After a run has been started, you can log training parameters (key-value parameters) in MLflow like this:
mlflow.log_param("iterations", 1000)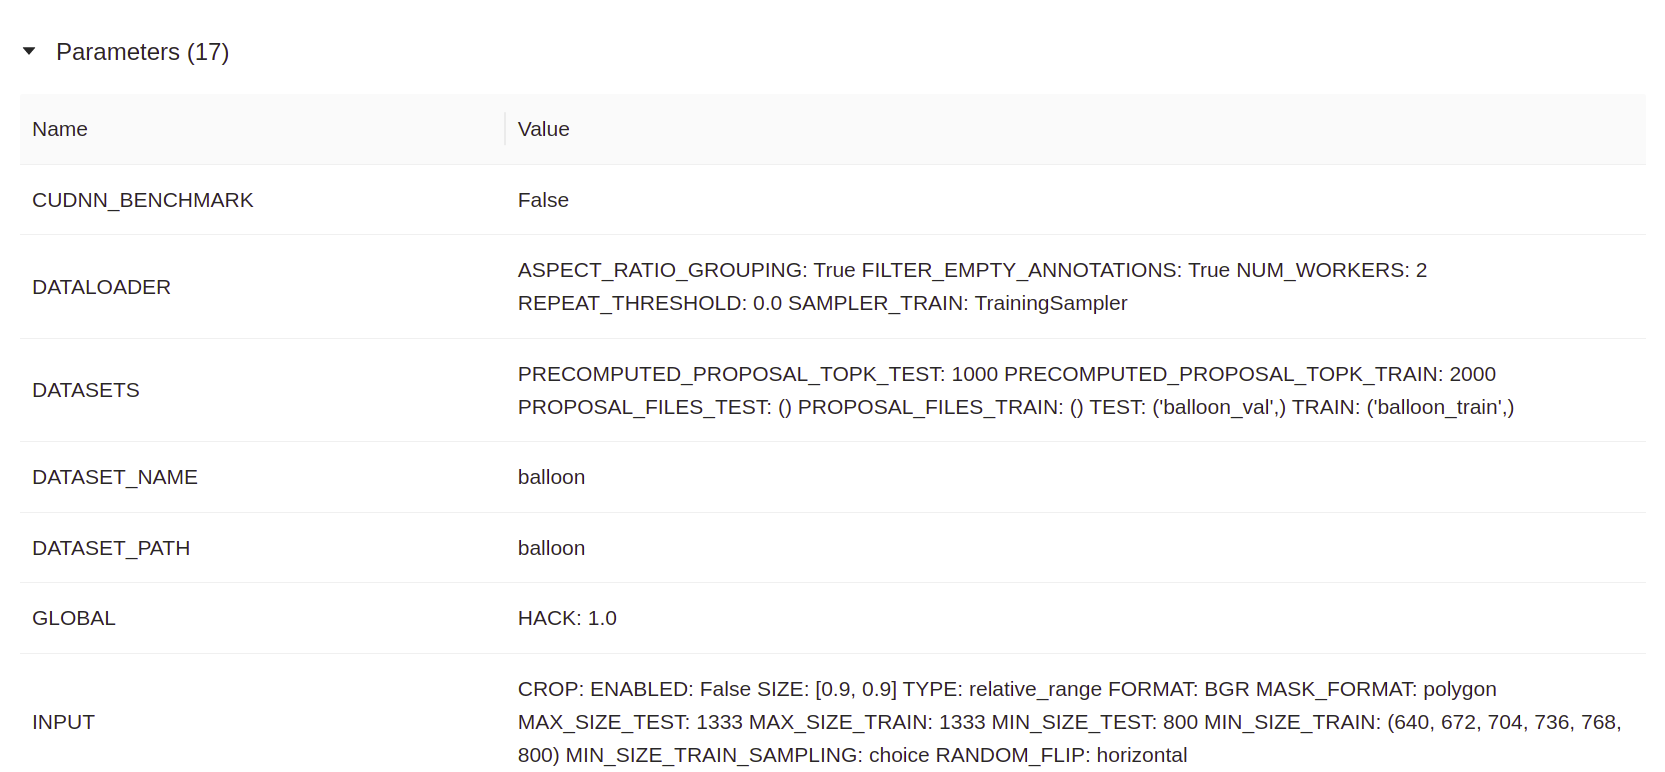
- Metrics: metrics (e.g. loss or AP) are handled differently by MLflow in that they can be updated throughout the course of the run. MLflow records the time-specific values of a metric and lets you visualize the metrics’s full history:
mlflow.log_metric("loss", 3.456248, step=0)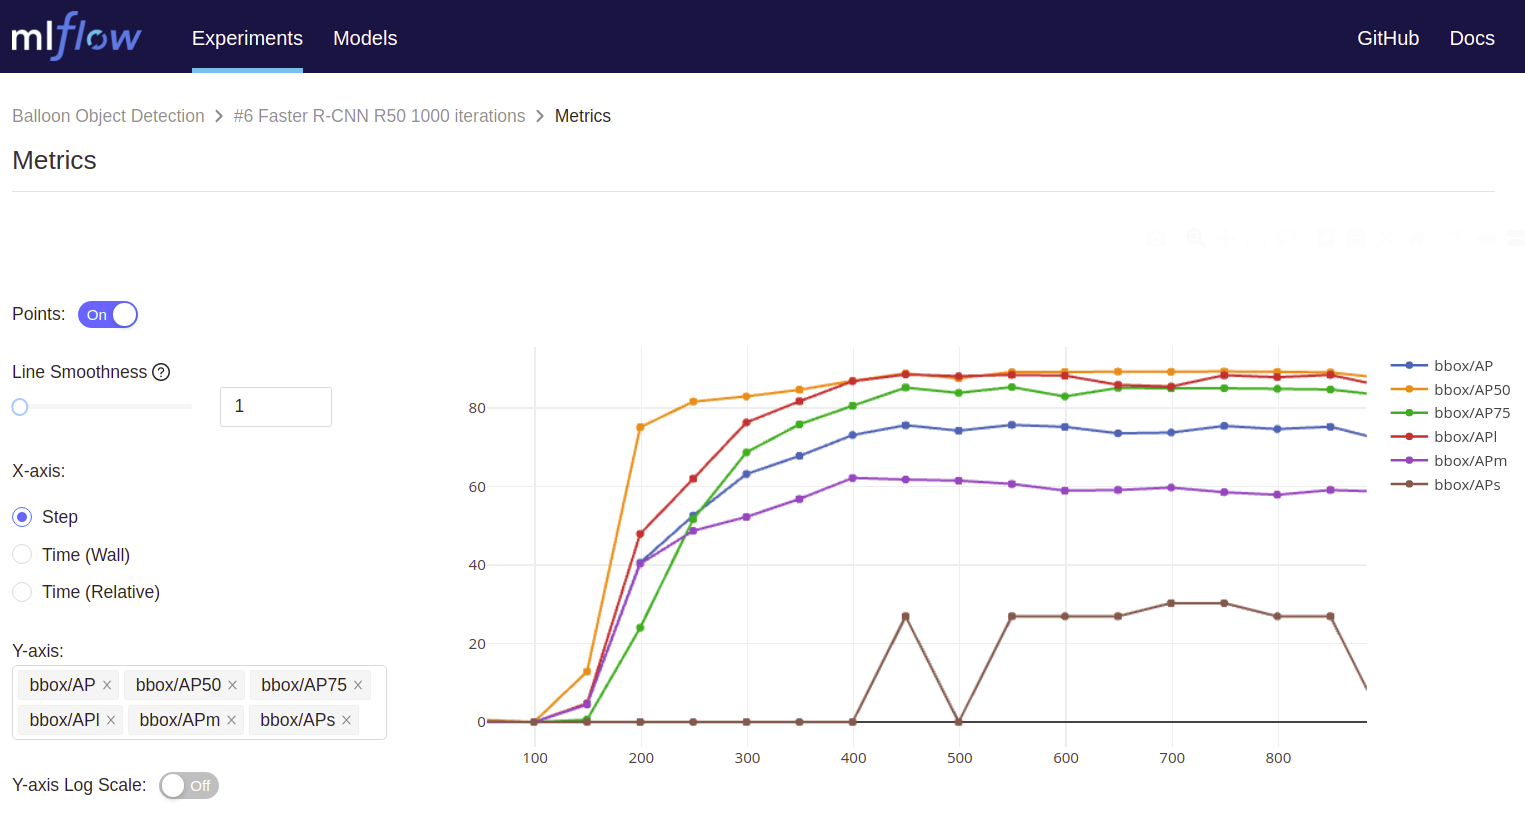
- Artifacts: you can log output files of your model training in any format as so-called artifacts, e.g. images, data files, models, log files, etc., like this:
mlflow.log_artifacts("output/")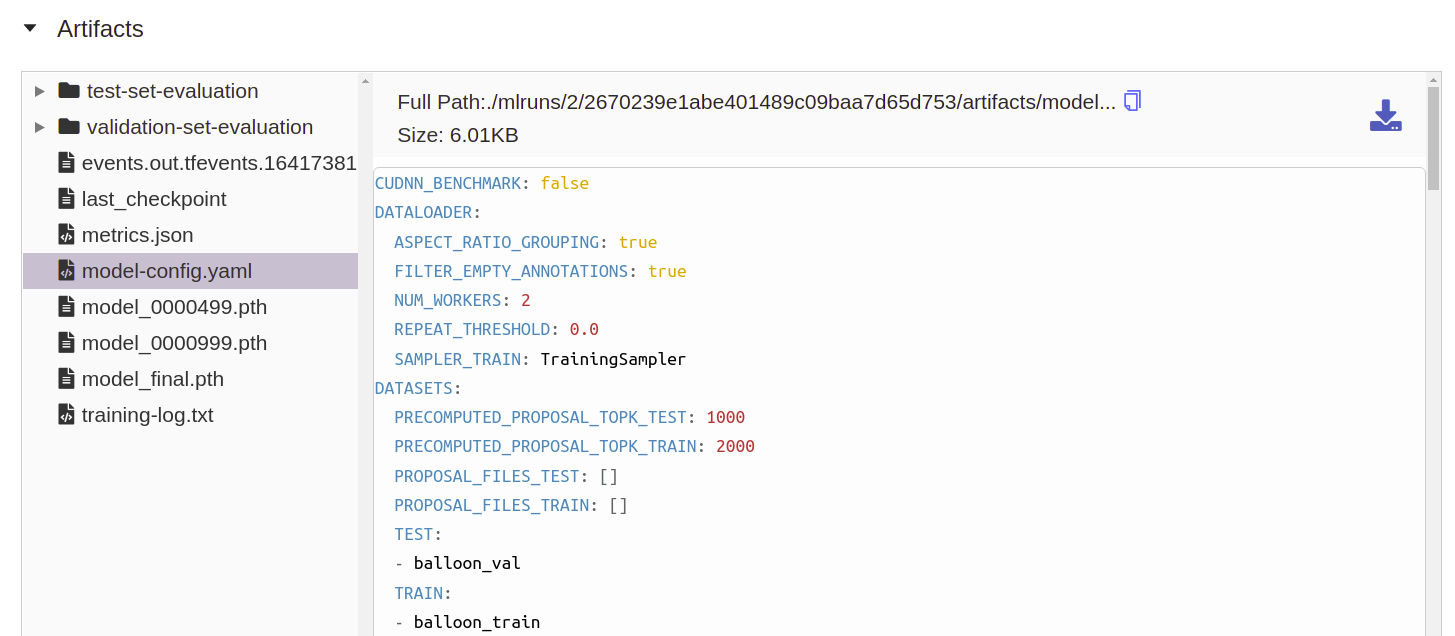
- Tags: lastly, you can annotate runs with tags (key-value parameters). There are System Tags which are reserved for internal use. For example, you can use the tag
mlflow.note.contentto set the run description:
mlflow.set_tag("mlflow.note.content", "First training with 1000 iterations, 210 images in the train set... blabla")
Step 1: extend Detectron2’s configuration
First, let’s extend the Detectron2 configuration so that we can make the hook , which we’ll implement in step 2, configurable and reusable. We’ll add four configurations under the new configuration node MLFLOW to make experiment name, run name, run description, and tracking server URI configurable:
1
2
3
4
5
6
7
8
9
from detectron2.config import get_cfg, CfgNode

cfg = get_cfg()

cfg.MLFLOW = CfgNode()
cfg.MLFLOW.EXPERIMENT_NAME = "Balloon Object Detection"
cfg.MLFLOW.RUN_DESCRIPTION = "First training with 1000 iterations, 210 images in the train set... blabla"
cfg.MLFLOW.RUN_NAME = "#0 first training"
cfg.MLFLOW.TRACKING_URI = "http://localhost:5000"
Step 2: implement a hook for MLflow
Now that we extended the Detectron2 configuration, we can implement a custom hook which uses the MLflow Python package to log all experiment artifacts, metrics, and parameters to an MLflow tracking server.
Hooks in Detectron2 must be subclasses of detectron2.engine.HookBase. Each hook can implement 4 methods (see the docs):
before_train()is called before the first training iterationafter_train()is called after the last training iterationbefore_step()is called before each training iterationafter_step()is called after each training iteration
Here’s my code snippet for the MLflow hook which implements three of these four methods:
1
2
3
4
5
6
7
8
9
10
11
12
13
14
15
16
17
18
19
20
21
22
23
24
25
26
27
28
29
30
31
32
33
from detectron2.engine import HookBase
import mlflow

class MLflowHook(HookBase):
    """
    A custom hook class that logs artifacts, metrics, and parameters to MLflow.
    """

    def __init__(self, cfg):
        super().__init__()
        self.cfg = cfg.clone()

    def before_train(self):
        with torch.no_grad():
            mlflow.set_tracking_uri(self.cfg.MLFLOW.TRACKING_URI)
            mlflow.set_experiment(self.cfg.MLFLOW.EXPERIMENT_NAME)
            mlflow.start_run(run_name=self.cfg.MLFLOW.RUN_NAME)
            mlflow.set_tag("mlflow.note.content",
                           self.cfg.MLFLOW.RUN_DESCRIPTION)
            for k, v in self.cfg.items():
                mlflow.log_param(k, v)

    def after_step(self):
        with torch.no_grad():
            latest_metrics = self.trainer.storage.latest()
            for k, v in latest_metrics.items():
                mlflow.log_metric(key=k, value=v[0], step=v[1])

    def after_train(self):
        with torch.no_grad():
            with open(os.path.join(self.cfg.OUTPUT_DIR, "model-config.yaml"), "w") as f:
                f.write(self.cfg.dump())
            mlflow.log_artifacts(self.cfg.OUTPUT_DIR)
Explanations:
-
In
before_train()we set the tracking server URI, experiment name, and run name and start the run. Optionally, we can also set the description of the run. Run name and run description can be changed later at any time. -
In
after_step()we request the latest training metrics from Detectron2’s EventStorage at each training iteration. The classEventStoragestores all training metrics (accuracies, losses, bbox APs, learning rate, etc.). We simply iterate over the most recent values of all metrics and log them to MLflow. This way all metrics which appear in TensorBoard will also be logged to MLflow. -
In
after_train()we dump the Detectron2 configuration to a YAML file and finally log all output files (inluding the configuration YAML) to MLflow. This allows us to track and reconstruct every training session afterwards, as all configurations and the model itself are stored in MLflow.
Step 3: add a custom trainer class for COCO metrics
We could start training our model right away but per default the DefaultTrainer of Detectron2 doesn’t evaluate the model on the validation/dev set. If we want to evaluate AR for object proposals or AP for instance detection/segmentation during training, then we’ll have write a custom trainer class which extends DefaultTrainer like this:
1
2
3
4
5
6
7
8
9
10
11
12
class CocoTrainer(DefaultTrainer):
    """
    A custom trainer class that evaluates the model on the validation set every `_C.TEST.EVAL_PERIOD` iterations.
    """

    @classmethod
    def build_evaluator(cls, cfg, dataset_name, output_folder=None):
        if output_folder is None:
            os.makedirs(cfg.OUTPUT_DIR_VALIDATION_SET_EVALUATION,
                        exist_ok=True)

        return COCOEvaluator(dataset_name, distributed=False, output_dir=cfg.OUTPUT_DIR_VALIDATION_SET_EVALUATION)
Step 4: train the model
Now we’re ready to start training our model with Detectron2. In line 17 we configure the logger of Detectron2 to write logs to a log file inside the output directory. This way the training log will be recorded in MLflow because all files in the output directory are send as artifacts to MLflow by our hook class. In line 19 we instantiate our hook class MLflowHook and register it with the DefaultTrainer in line 22.
Please note: The following code snippet assumes that you already went through the steps of registering your dataset (train set, val/dev set, and test set) in Detectron2’s DatasetCatalog and MetadataCatalog. I skipped these steps section because they are specific to your use case / dataset.
1
2
3
4
5
6
7
8
9
10
11
12
13
14
15
16
17
18
19
20
21
22
23
24
25
26
27
import os

from detectron2.engine import DefaultTrainer

cfg.merge_from_file(model_zoo.get_config_file("COCO-Detection/faster_rcnn_R_50_FPN_1x.yaml"))
cfg.DATASETS.TRAIN = ("balloon_train",)
cfg.DATASETS.TEST = ("balloon_val",)
cfg.SOLVER.MAX_ITER = 1000
cfg.OUTPUT_DIR = datetime.now().strftime("%Y-%m-%d_%H-%M-%S-output")
cfg.OUTPUT_DIR_VALIDATION_SET_EVALUATION = os.path.join(
        cfg.OUTPUT_DIR, "validation-set-evaluation")
cfg.OUTPUT_DIR_TEST_SET_EVALUATION = os.path.join(
        cfg.OUTPUT_DIR, "test-set-evaluation")
cfg.TEST.EVAL_PERIOD = 100

os.makedirs(cfg.OUTPUT_DIR, exist_ok=True)
os.makedirs(cfg.OUTPUT_DIR_VALIDATION_SET_EVALUATION, exist_ok=True)
os.makedirs(cfg.OUTPUT_DIR_TEST_SET_EVALUATION, exist_ok=True)

setup_logger(output=os.path.join(cfg.OUTPUT_DIR, "training-log.txt"))

mlflow_hook = MLflowHook(cfg)

trainer = CocoTrainer(cfg)
trainer.register_hooks(hooks=[mlflow_hook])
trainer.resume_or_load(resume=False)
trainer.train()
Step 5: evaluate the model on the test set
Assuming that you have a train set, a val/dev set, and a separate test set, you might want to evaluate the trained model on your test and log the results to MLflow, too. Let’s do this!
1
2
3
4
5
6
7
8
9
10
11
12
13
14
15
16
17
18
19
20
21
from detectron2.data import build_detection_test_loader
from detectron2.engine import DefaultPredictor
from detectron2.evaluation import COCOEvaluator, inference_on_dataset

setup_logger(output=os.path.join(cfg.OUTPUT_DIR_TEST_SET_EVALUATION, "evaluation-log.txt"))

cfg.MODEL.WEIGHTS = os.path.join(cfg.OUTPUT_DIR, "model_final.pth")

predictor = DefaultPredictor(cfg)

evaluator = COCOEvaluator("balloon_test", output_dir=cfg.OUTPUT_DIR_TEST_SET_EVALUATION)
test_set_loader = build_detection_test_loader(cfg, "balloon_test")

evaluation_results = inference_on_dataset(predictor.model, test_set_loader, evaluator)
logging.info("Evaluation results on test set: %s", evaluation_results)

for k, v in evaluation_results["bbox"].items():
    mlflow.log_metric(f"Test Set {k}", v, step=0)

mlflow.log_artifacts(cfg.OUTPUT_DIR_TEST_SET_EVALUATION, "test-set-evaluation")
mlflow.log_text(str(evaluation_results), "test-set-evaluation/coco-metrics.txt")
Explanations:
- In line 5 we set up the logger to log to a different file now that the model training is done.
- In line 7 we update the configuration so that the weights of the previously trained model are used (instead of pre-trained COCO/ImageNet weights).
- In line 11 we instantiate the
COCOEvaluatorfor our test set (registered inDatasetCatalogunder the nameballoon_test) and set the output directory. -
In line 17 and 18 we iterate over all bbox COCO metrics (e.g.
AP,AP50,AP75,APl,APm,APs) and log these as metrics to MLflow. This should give you the following result in MLflow:
- In line 20 we record the artifacts that were produced by
COCOEvaluatorin its output directory. -
Finally, we log the COCO metrics again (this time as artifact instead of a metric) to a virtual text file named
coco-metrics.txtwhich should appear under MLflow’s artifact section: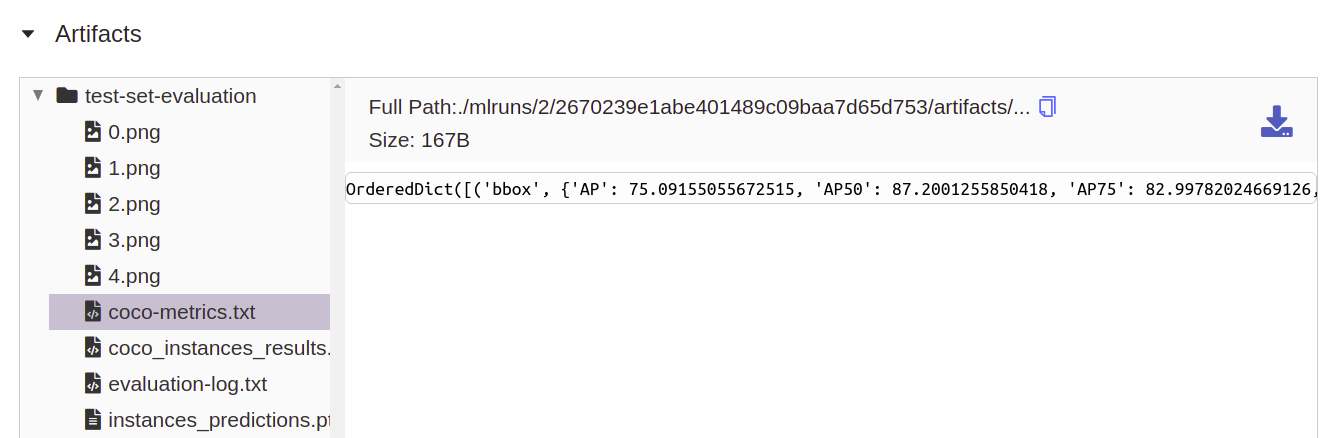
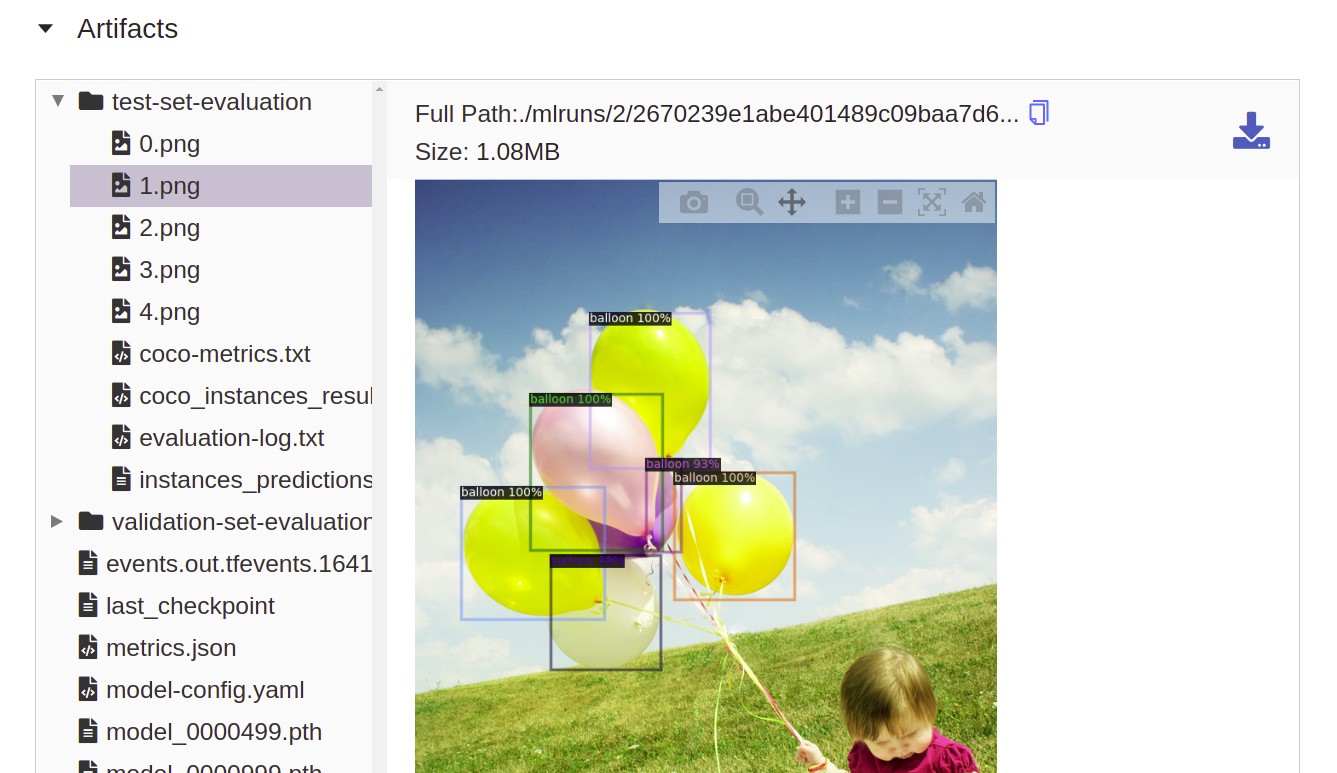
Additionally, you could run your model in inference mode on a few random images of your test set, visualize the predictions, and log the resulting images in MLflow (not part of this blog post). MLflow integrates a simple image viewer with zoom and pan functionality:
Step 6: end the MLflow run
If you want to see a green check mark in MLflow and the run status set to FINISHED, then the last step is to end your MLflow run like this:
mlflow.end_run()
Results
As a result of the previous steps the MLflow UI should contain one experiment with one run which contains the parameters, metrics, and artifacts of your Detectron2 model training.
Thank you for reading this blog post and good luck with your deep learning project! Let me know in the comments down below if you have any feedback or improvements.